前置:處理地圖檔的變項
在此先計算各鄉鎮市區的65歲以上人口所佔的百分比。
library (sf)library (dplyr)library (magrittr)library (tmap)# 地圖 <- st_read ("D:/map/111年6月行政區三段年齡組性別人口統計_鄉鎮市區.SHP" ,crs= 3826 ,options= "ENCODING=big-5" )
options:        ENCODING=big-5
Reading layer `111年6月行政區三段年齡組性別人口統計_鄉鎮市區' from data source `D:\map\111年6月行政區三段年齡組性別人口統計_鄉鎮市區.SHP'
  using driver `ESRI Shapefile'
Simple feature collection with 368 features and 14 fields
Geometry type: MULTIPOLYGON
Dimension:     XY
Bounding box:  xmin: -197572.5 ymin: 2295201 xmax: 606875.6 ymax: 2919551
Projected CRS: TWD97 / TM2 zone 121
<- st_transform (town,crs= 4326 )<- mutate (town,old_percent= (A65UP_CNT/ (A0A14_CNT+ A15A64_CNT+ A65UP_CNT)* 100 ))$ old_percent <- round (town$ old_percent,2 )
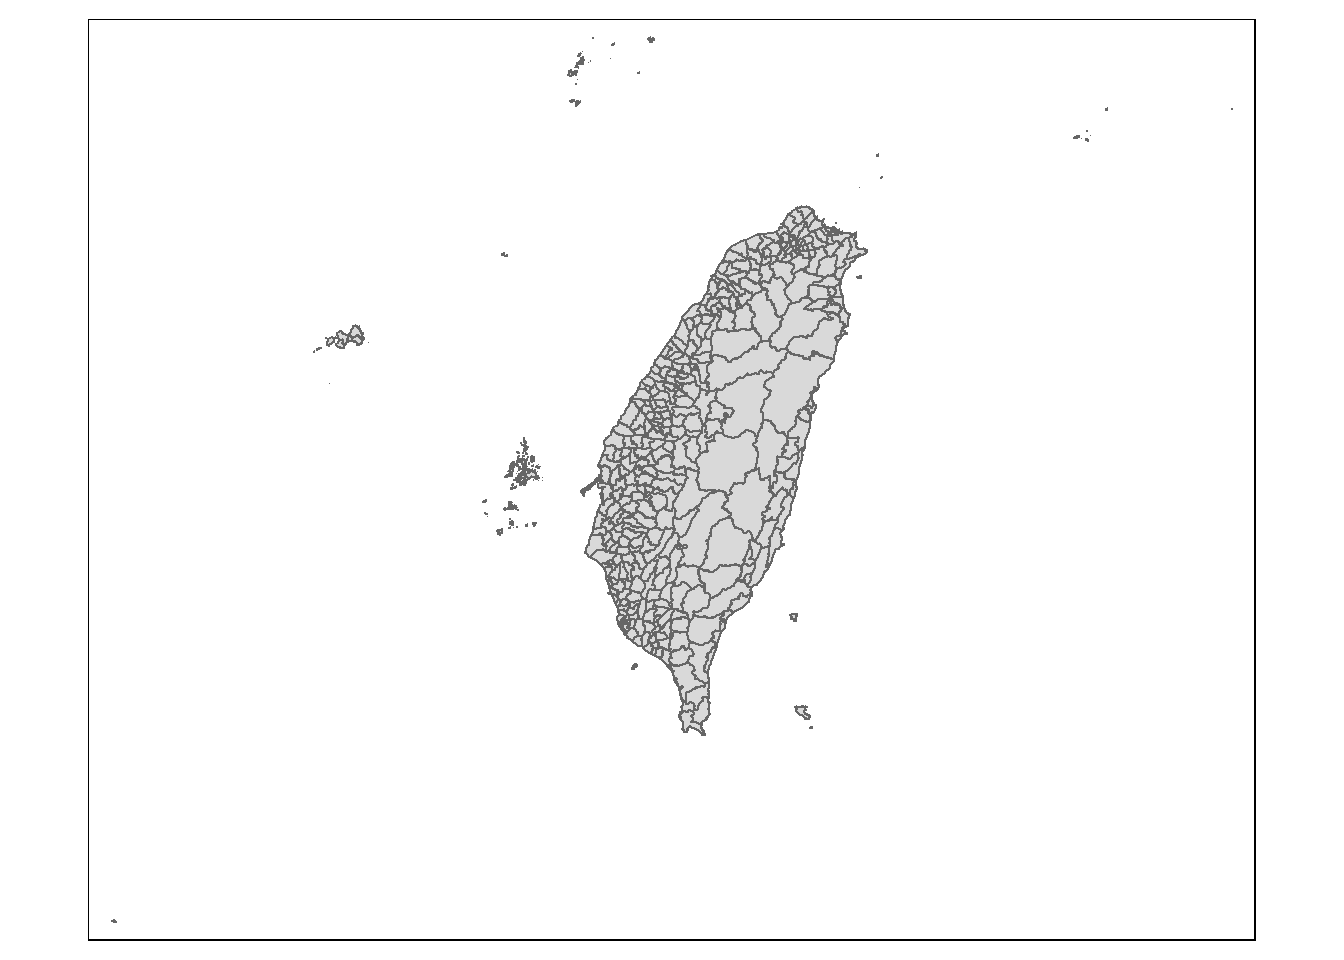
如何使用tmap畫出區域輪廓圖?
tm_shape (town)+ tm_polygons ()
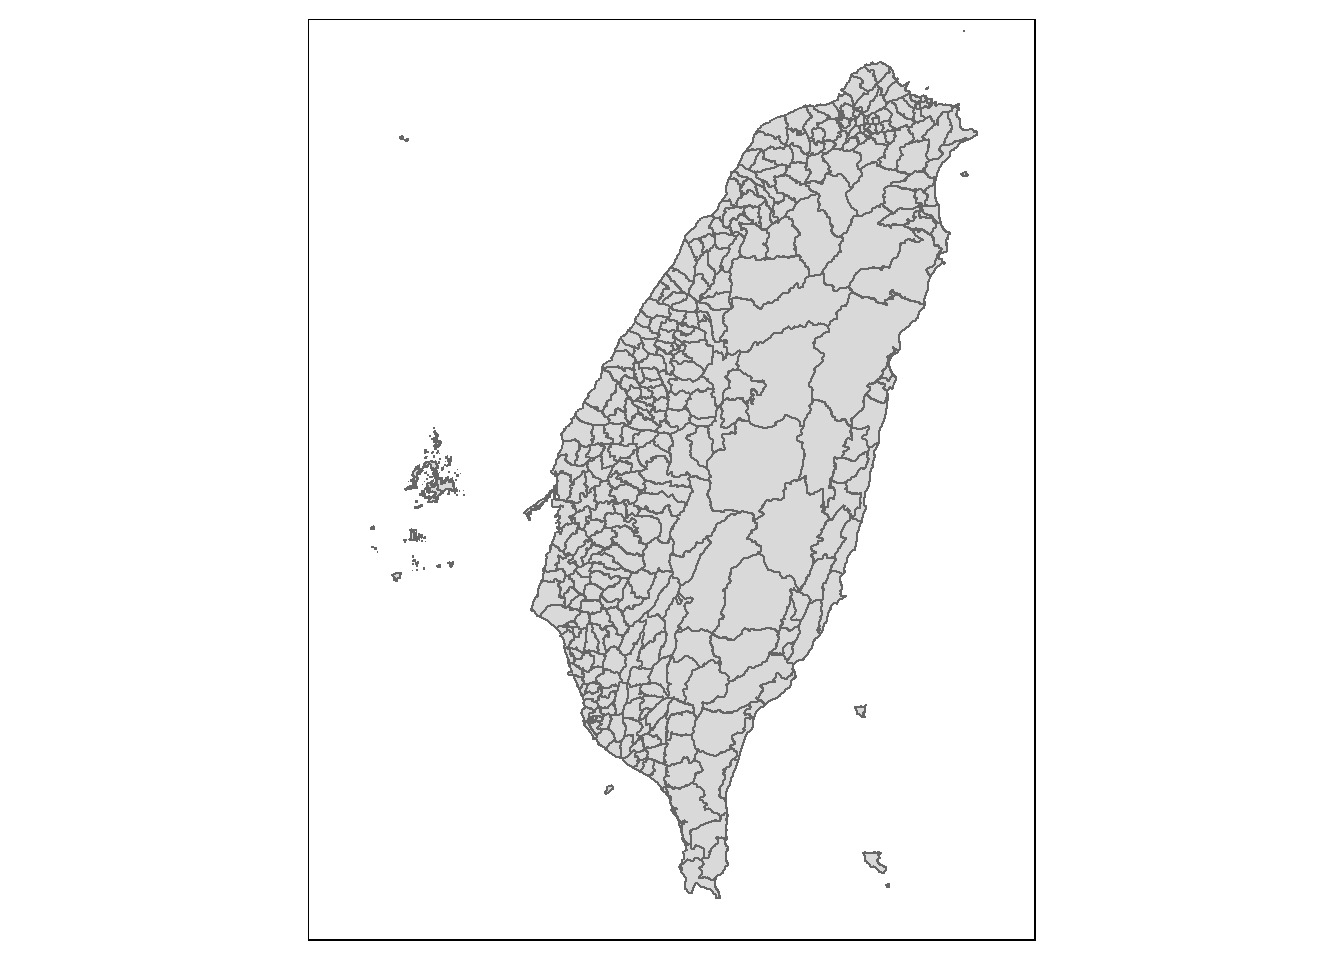
如何僅畫出地圖的某些範圍?
tm_shape (town,xlim= c (119.1 ,122.2 ),ylim= c (21.8 ,25.4 ))+ tm_polygons ()
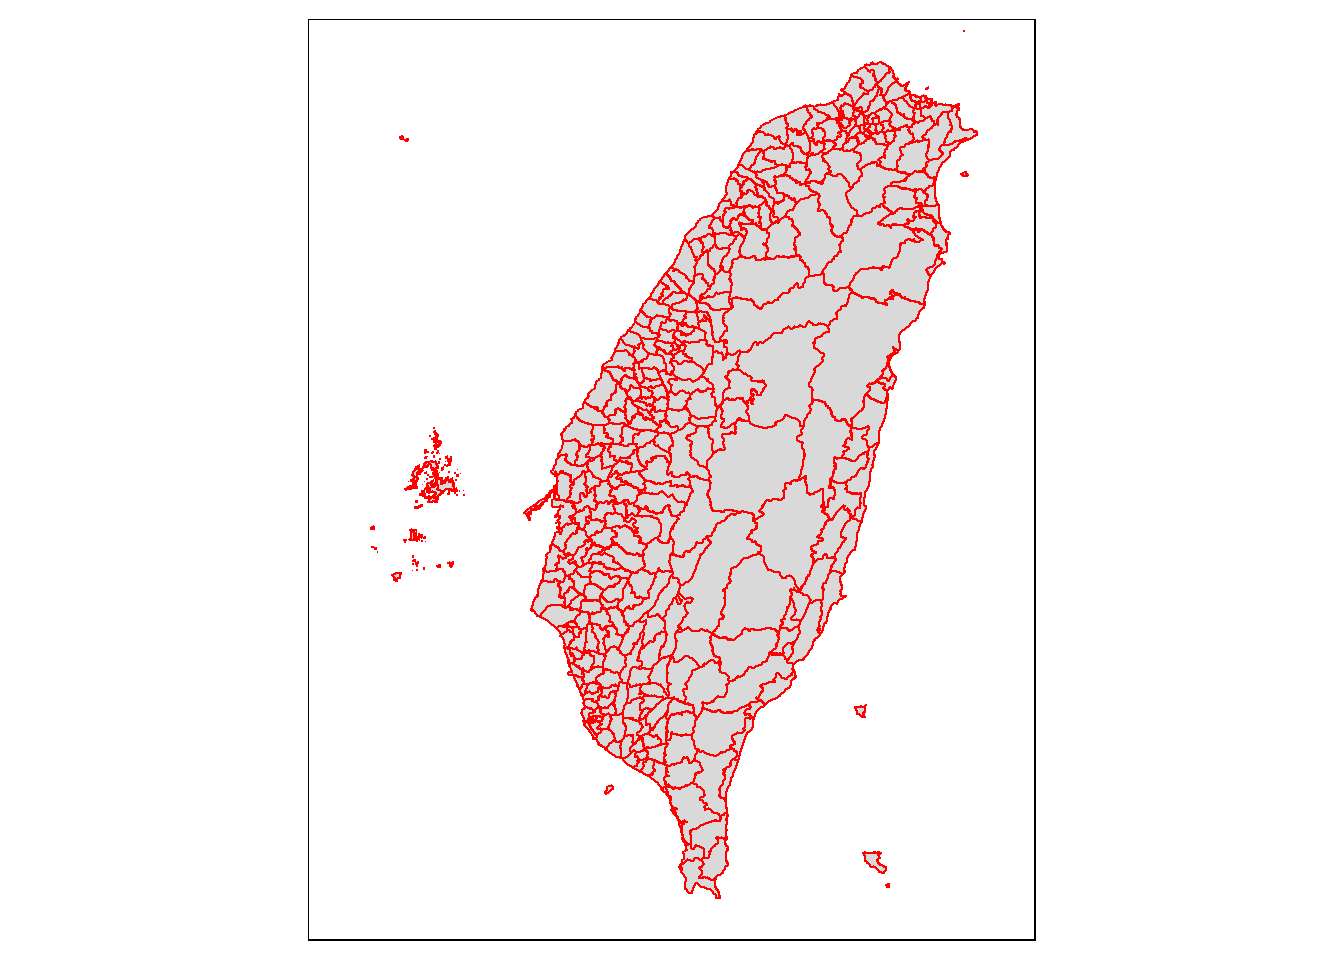
如何將地圖的輪廓著色?
tm_shape (town,xlim= c (119.1 ,122.2 ),ylim= c (21.8 ,25.4 ))+ tm_polygons (border.col= 'red' )
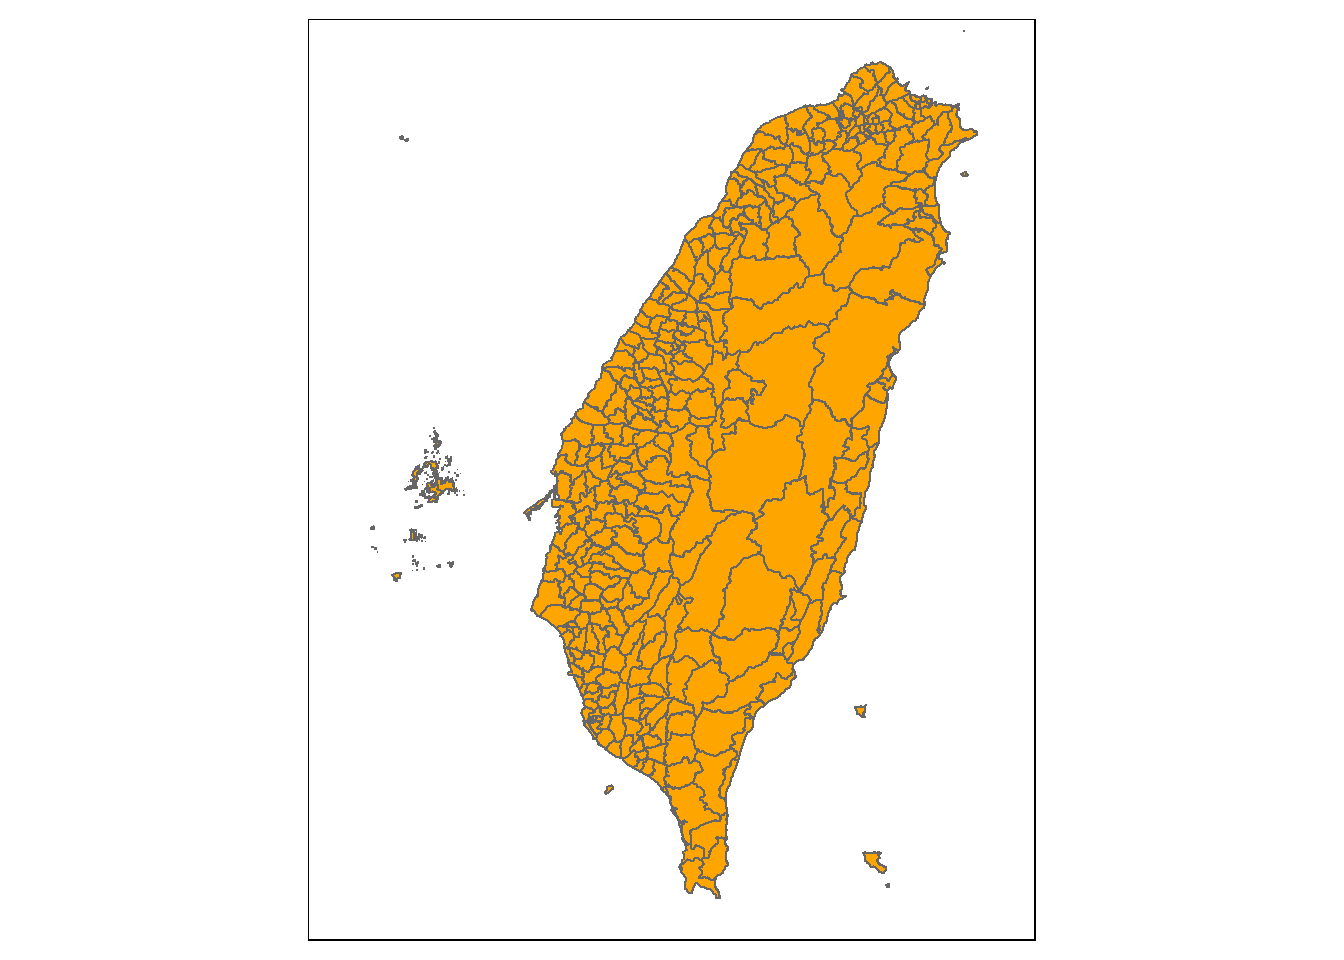
如何將地圖的框內(polygons)著色?
tm_shape (town,xlim= c (119.1 ,122.2 ),ylim= c (21.8 ,25.4 ))+ tm_polygons (col= 'orange' )
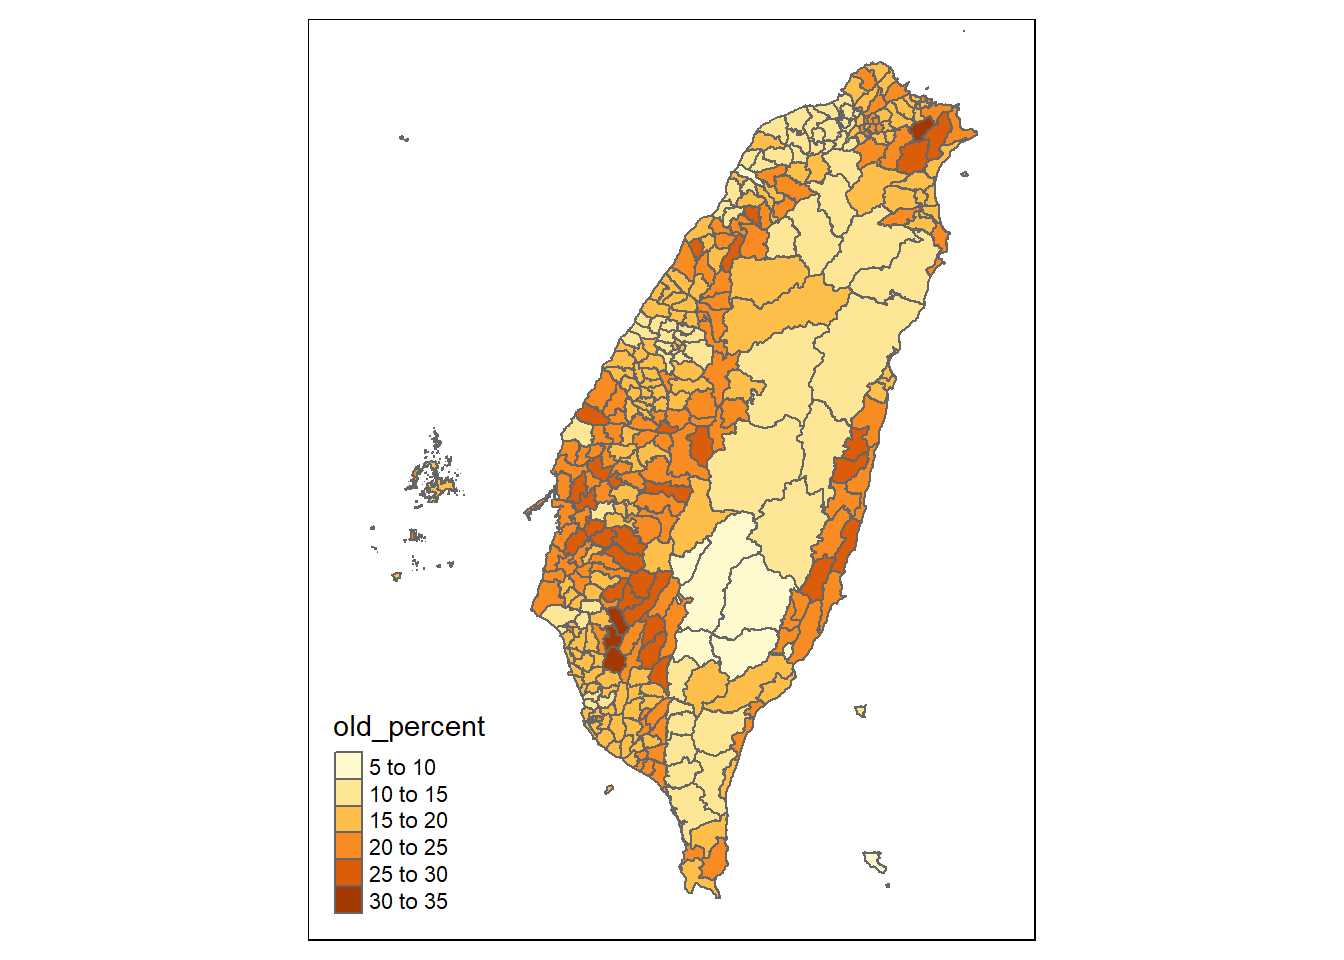
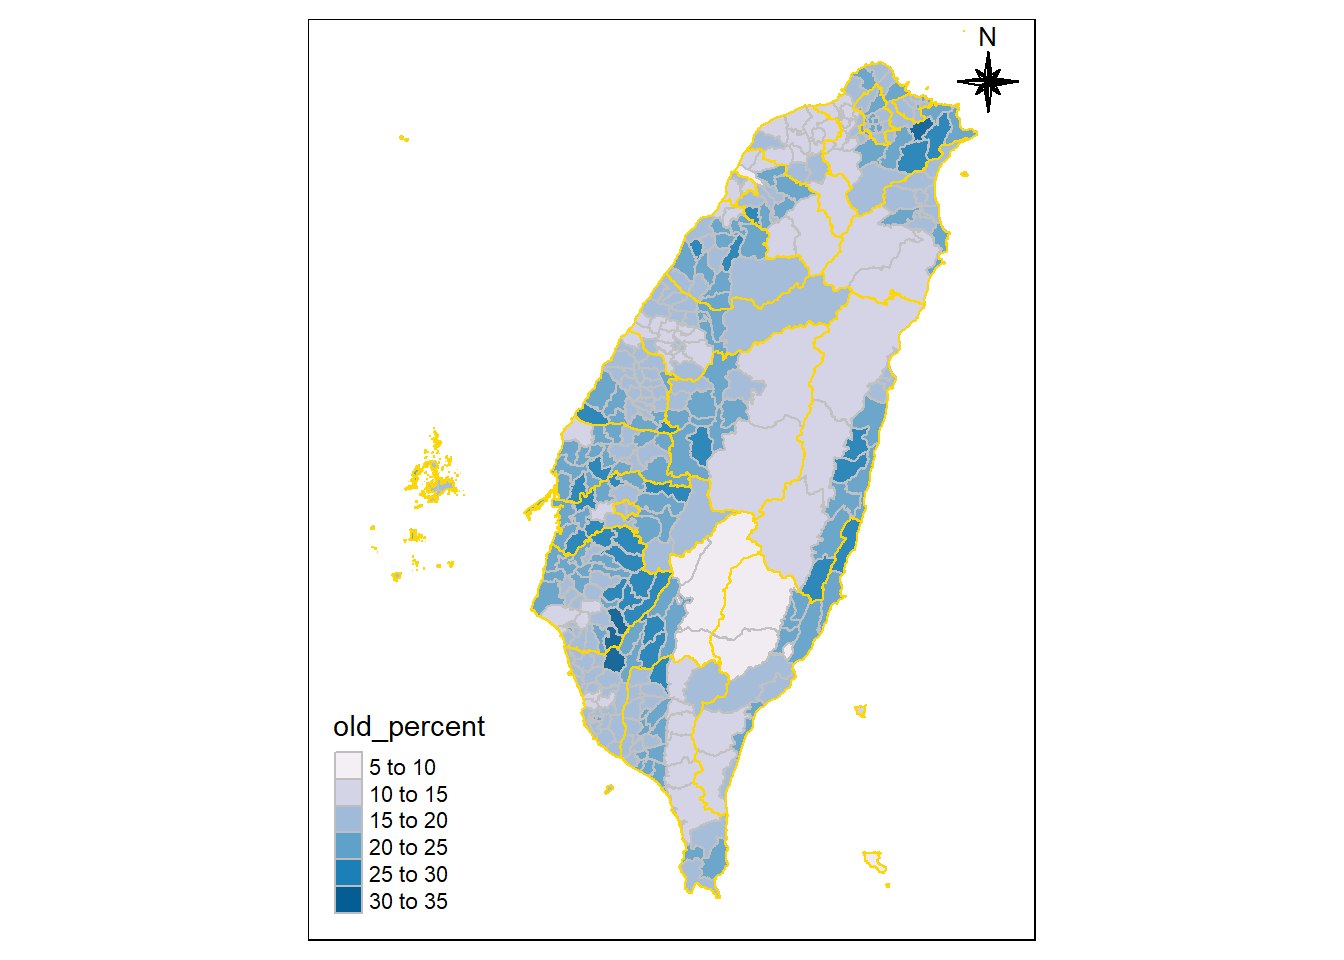
如何將地圖按照某變項的數值著色(分級著色圖choropleth map)?
old_percent是該地區(在此為鄉鎮市區)65歲以上人口的百分比。
tm_shape (town,xlim= c (119.1 ,122.2 ),ylim= c (21.8 ,25.4 ))+ tm_polygons (col= 'old_percent' )
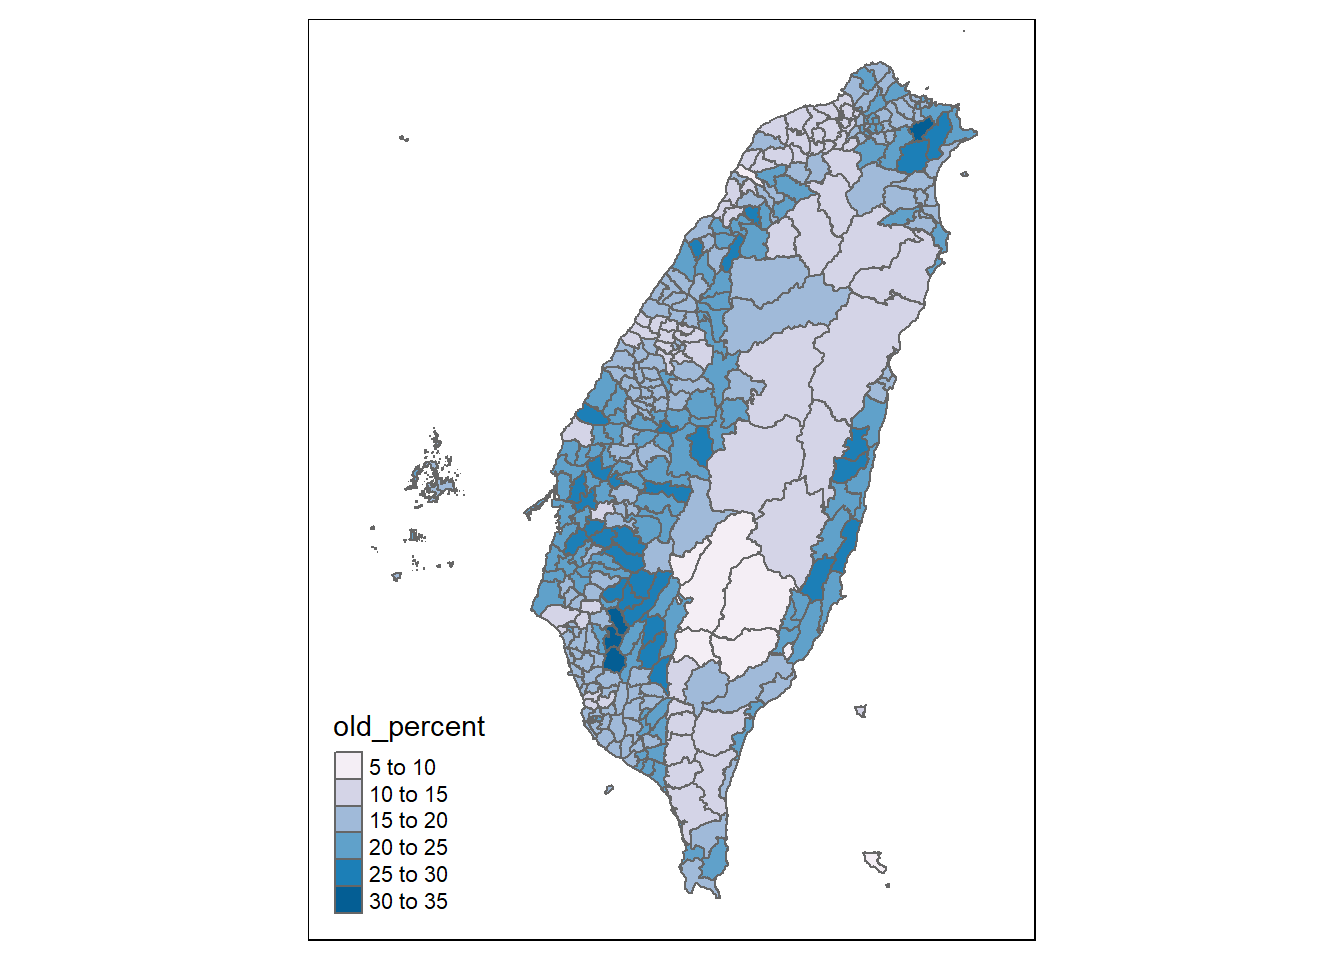
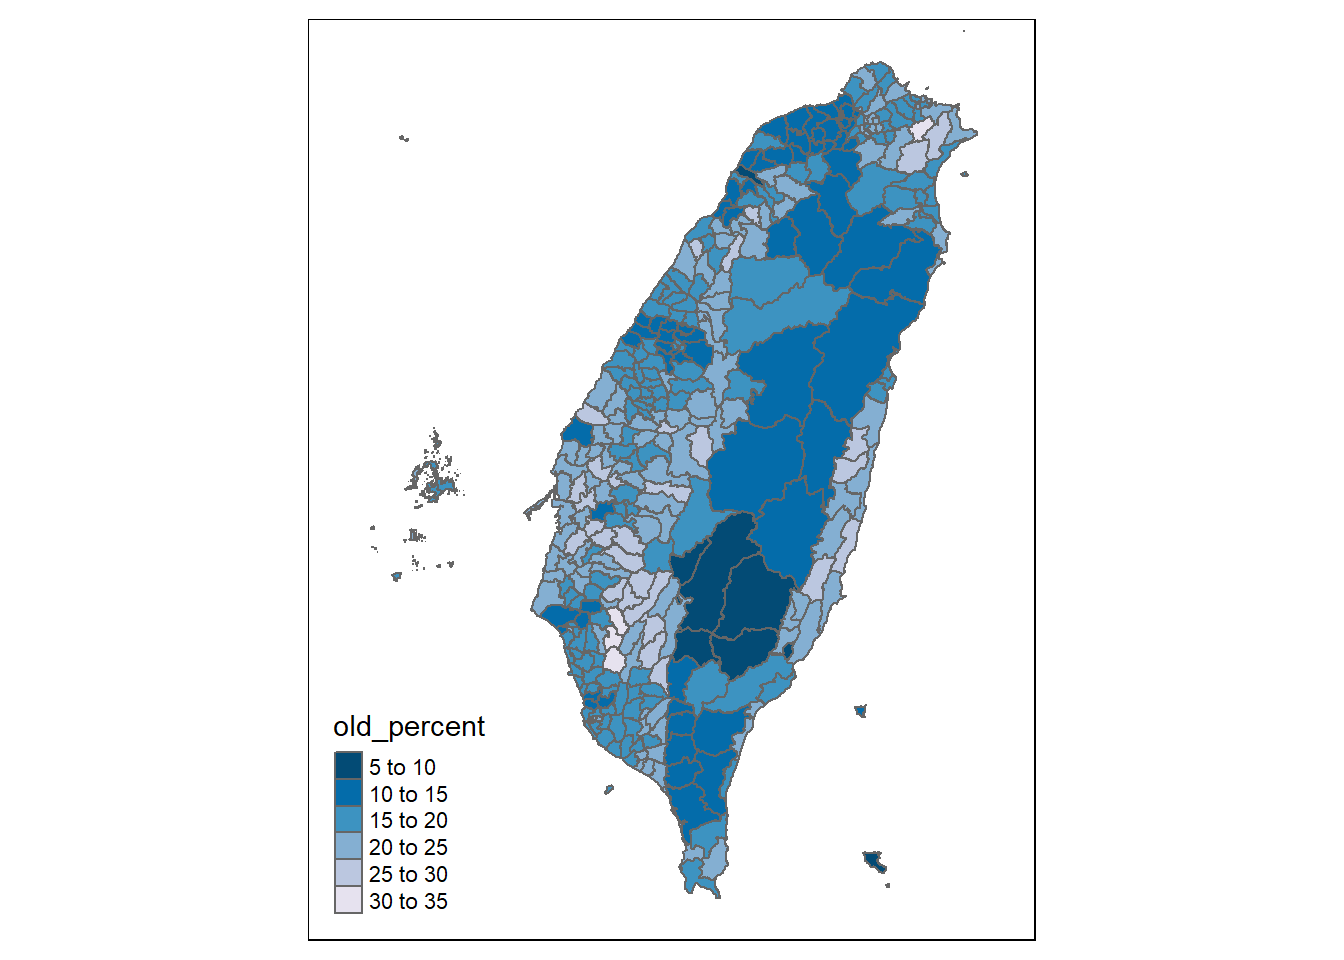
如何在chroplethro map使用不同的顏色?
tm_shape (town,xlim= c (119.1 ,122.2 ),ylim= c (21.8 ,25.4 ))+ tm_polygons (col= 'old_percent' ,palette= 'PuBu' )# 色盤名稱加上減號"-"即可將色盤反向 tm_shape (town,xlim= c (119.1 ,122.2 ),ylim= c (21.8 ,25.4 ))+ tm_polygons (col= 'old_percent' ,palette= '-PuBu' )
如何在不同圖層使用不同顏色界線,如標示村里界線、鄉鎮市區界線、縣界線?
tmap可以使用不同圖層用加號疊加在一起。
可以使用alpha選項調整圖層的透明度,其值為0~1,0為完全透明,1為完全不透明(預設值)。
# 將鄉鎮市區的地圖去掉鄉鎮市鎮線而產生縣市界線圖 <- town %>% group_by (COUNTY_ID)%>% summarise ()tm_shape (town,xlim= c (119.1 ,122.2 ),ylim= c (21.8 ,25.4 ))+ tm_polygons (col= 'old_percent' ,palette= 'PuBu' ,border.col = 'gray' )+ tm_shape (county,xlim= c (119.1 ,122.2 ),ylim= c (21.8 ,25.4 ))+ tm_polygons (border.col = 'gold' ,alpha = 0.1 )
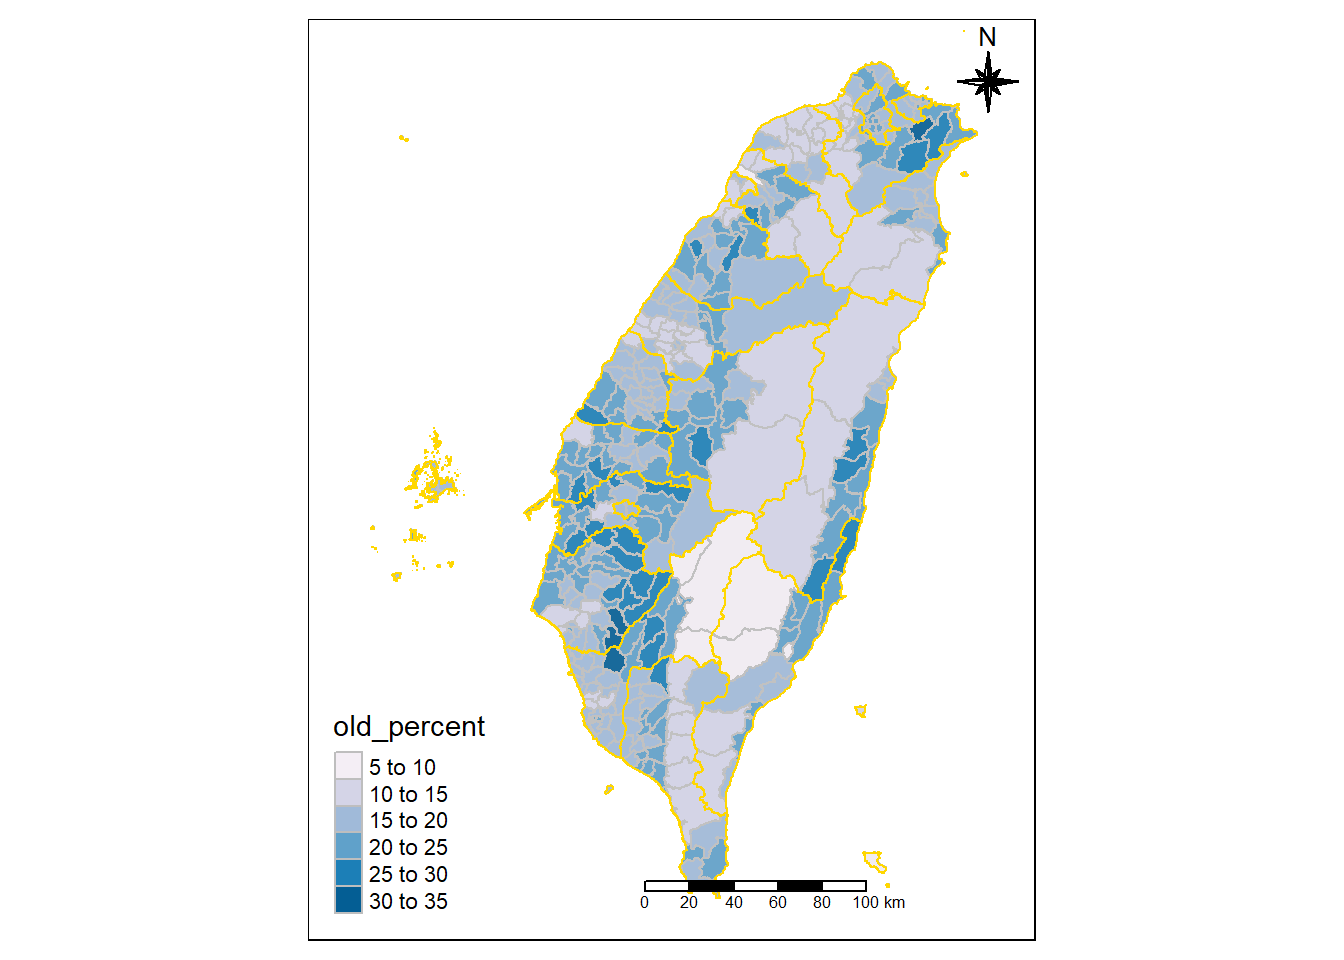
如何加上指北針?
tm_shape (town,xlim= c (119.1 ,122.2 ),ylim= c (21.8 ,25.4 ))+ tm_polygons (col= 'old_percent' ,palette= 'PuBu' ,border.col = 'gray' )+ tm_shape (county,xlim= c (119.1 ,122.2 ),ylim= c (21.8 ,25.4 ))+ tm_polygons (border.col = 'gold' ,alpha = 0.1 )+ tm_compass (type= '8star' ,size= 2 ,position = c ("RIGHT" ,'TOP' ))
一些選項
north: 北方的方向,數值為0到360,0代表上方(預設值),90代表向右方。
type: 指北針的類型,有五種,“arrow”(預設值),“4star”,“8star”,“radar”,“rose”。
size: 指北針的大小,“arrow”預設為2,“4star”預設為4,“8star”預設為4,“radar”預設為6,“rose”預設為6。
show.labels: 是否顯示「東西南北」文字。數值為0~3。0表示不顯示,1(預設值)顯示北方,2顯示四個方位,3顯示八個方位。
position: 指北針在地圖上所放置的位置。可用文字或數字指定。若用文字:第一個文字需為以下其中之一,“left”, “LEFT”, “center”, “right”, “RIGHT” ,第二個文字需為以下其中之一”top”, “TOP”, “center”, “bottom”, “BOTTOM”,大寫表示在指北針跟邊框之間不留間距。若用數字,則為指定x,y位置,從左到右為0~1,從下到上為0~1。
如何加上刻度尺(scale)?
tm_shape (town,xlim= c (119.1 ,122.2 ),ylim= c (21.8 ,25.4 ))+ tm_polygons (col= 'old_percent' ,palette= 'PuBu' ,border.col = 'gray' )+ tm_shape (county,xlim= c (119.1 ,122.2 ),ylim= c (21.8 ,25.4 ))+ tm_polygons (border.col = 'gold' ,alpha = 0.1 )+ tm_compass (type= '8star' ,size= 2 ,position = c ("RIGHT" ,'TOP' ))+ tm_scale_bar (position= c ("left" , "bottom" ))
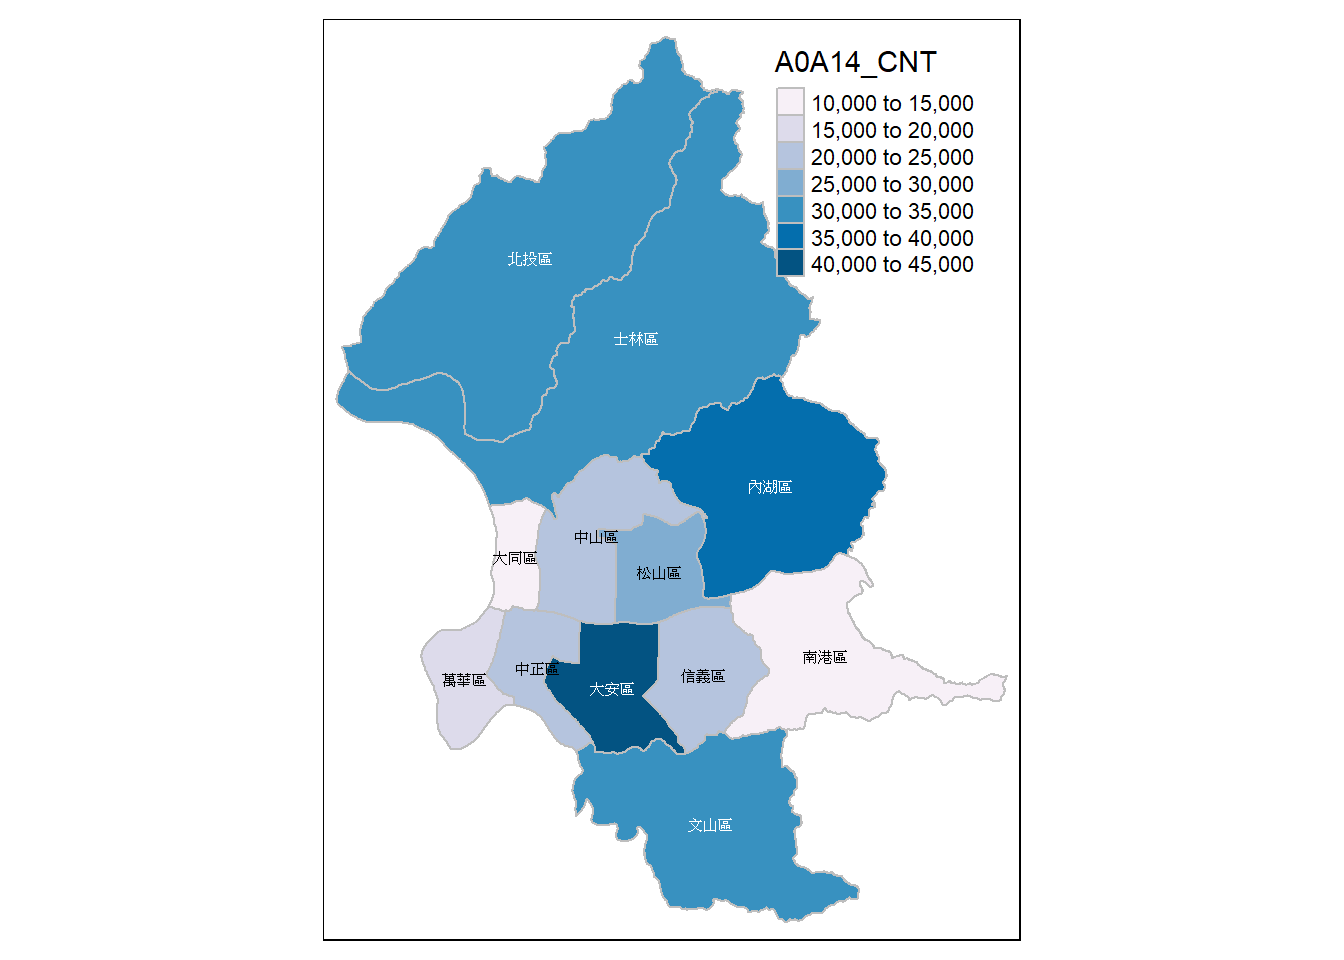
如何在地圖上加上文字(label)?
<- filter (town,COUNTY== "臺北市" )tm_shape (town.taipei)+ tm_polygons (col= 'A0A14_CNT' ,palette= 'PuBu' ,border.col = 'gray' )+ tm_text (text= 'TOWN' ,size = 0.5 )
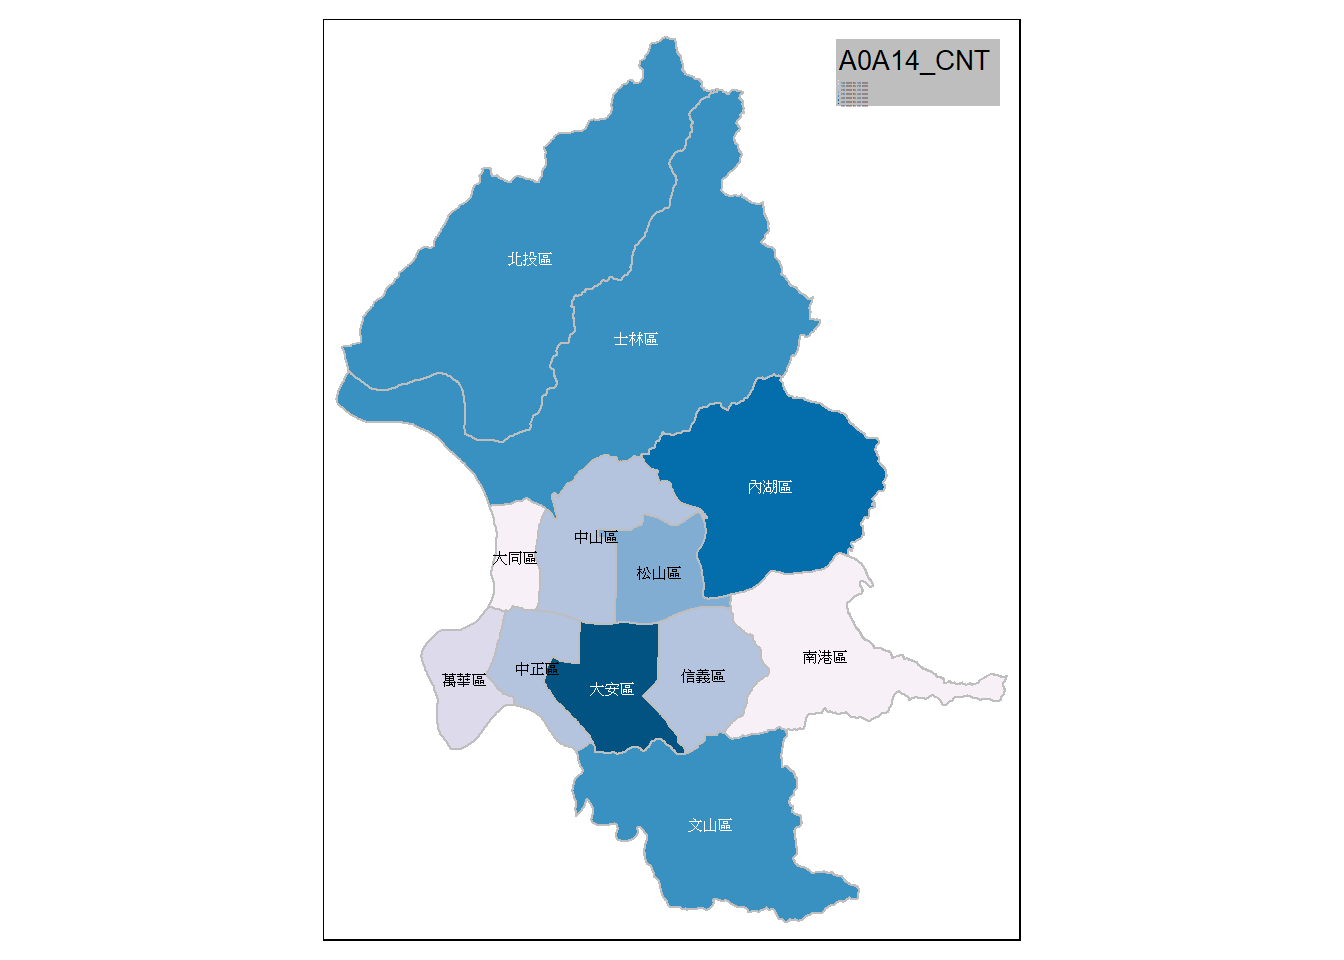
如何改變圖例(legend)的位置、大小等?
<- filter (town,COUNTY== "臺北市" )tm_shape (town.taipei)+ tm_polygons (col= 'A0A14_CNT' ,palette= 'PuBu' ,border.col = 'gray' )+ tm_text (text= 'TOWN' ,size = 0.5 )+ tm_layout (legend.title.size = 1 ,legend.text.size = 0.1 ,legend.position = c ("right" ,"top" ),legend.bg.color = "gray" )
tmap改變圖例的位置的相關語法藏在tm_layout()中,可在tm_layout中設定。
如何改變圖例的文字(legend label)?
尚未發現方法,暫時的方法:可以改變所要用來繪圖的變項名稱,則圖例文字就是該變項名稱。
如何將多張地圖並列顯示?
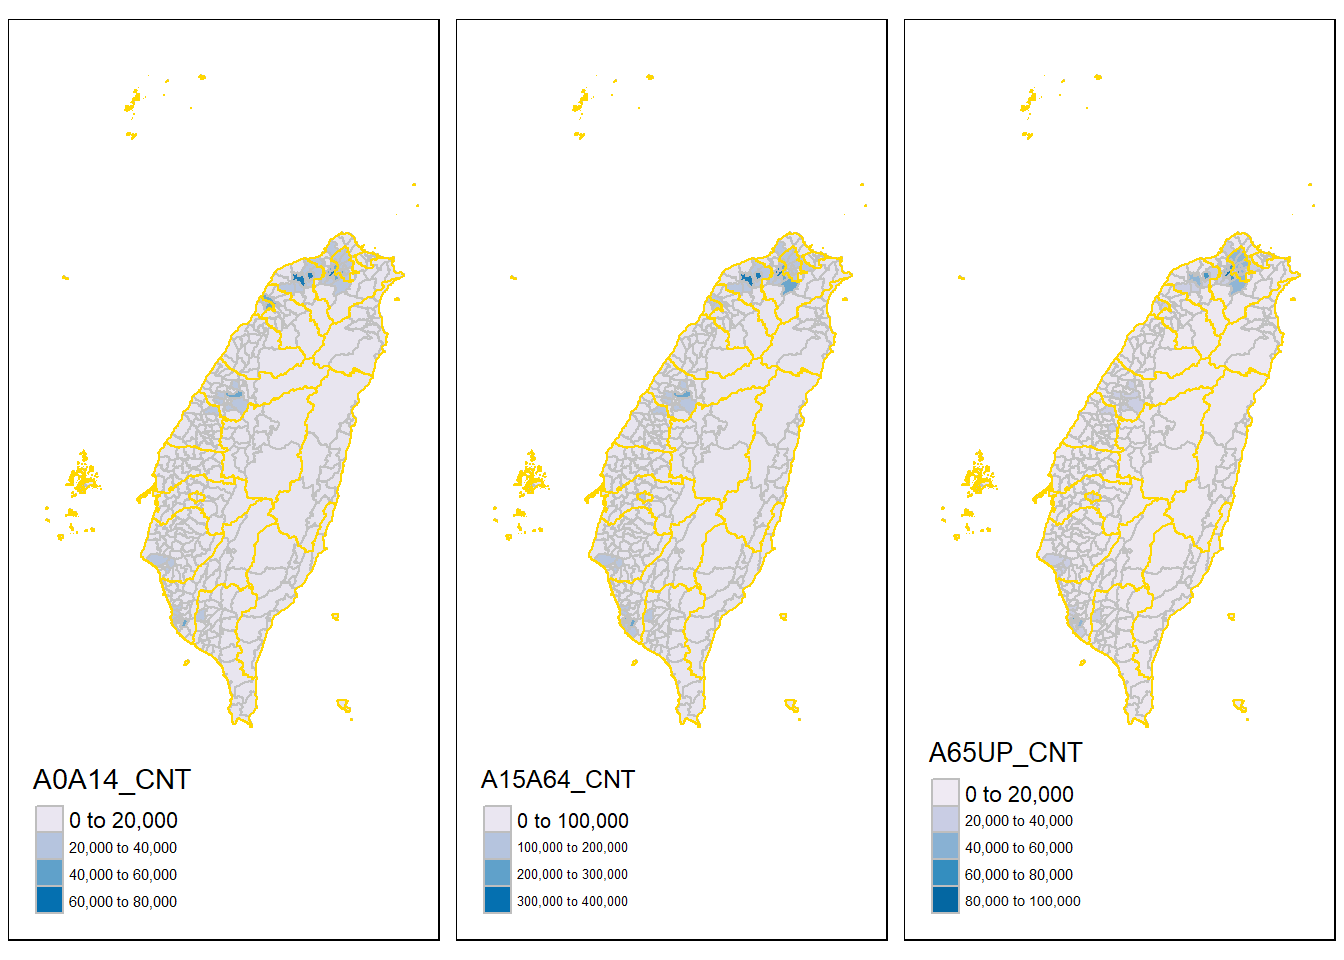
# 圖A <- tm_shape (town,xlim= c (119.1 ,122.2 ),ylim= c (21.8 ,25.4 ))+ tm_polygons (col= 'A0A14_CNT' ,palette= 'PuBu' ,border.col = 'gray' )+ tm_shape (county,xlim= c (119.1 ,122.2 ),ylim= c (21.8 ,25.4 ))+ tm_polygons (border.col = 'gold' ,alpha = 0.1 )# 圖B <- tm_shape (town,xlim= c (119.1 ,122.2 ),ylim= c (21.8 ,25.4 ))+ tm_polygons (col= 'A15A64_CNT' ,palette= 'PuBu' ,border.col = 'gray' )+ tm_shape (county,xlim= c (119.1 ,122.2 ),ylim= c (21.8 ,25.4 ))+ tm_polygons (border.col = 'gold' ,alpha = 0.1 )# 圖C <- tm_shape (town,xlim= c (119.1 ,122.2 ),ylim= c (21.8 ,25.4 ))+ tm_polygons (col= 'A65UP_CNT' ,palette= 'PuBu' ,border.col = 'gray' )+ tm_shape (county,xlim= c (119.1 ,122.2 ),ylim= c (21.8 ,25.4 ))+ tm_polygons (border.col = 'gold' ,alpha = 0.1 )tmap_arrange (map.a,map.b,map.c)
如何將多張地圖並列及讓圖例的數值一致
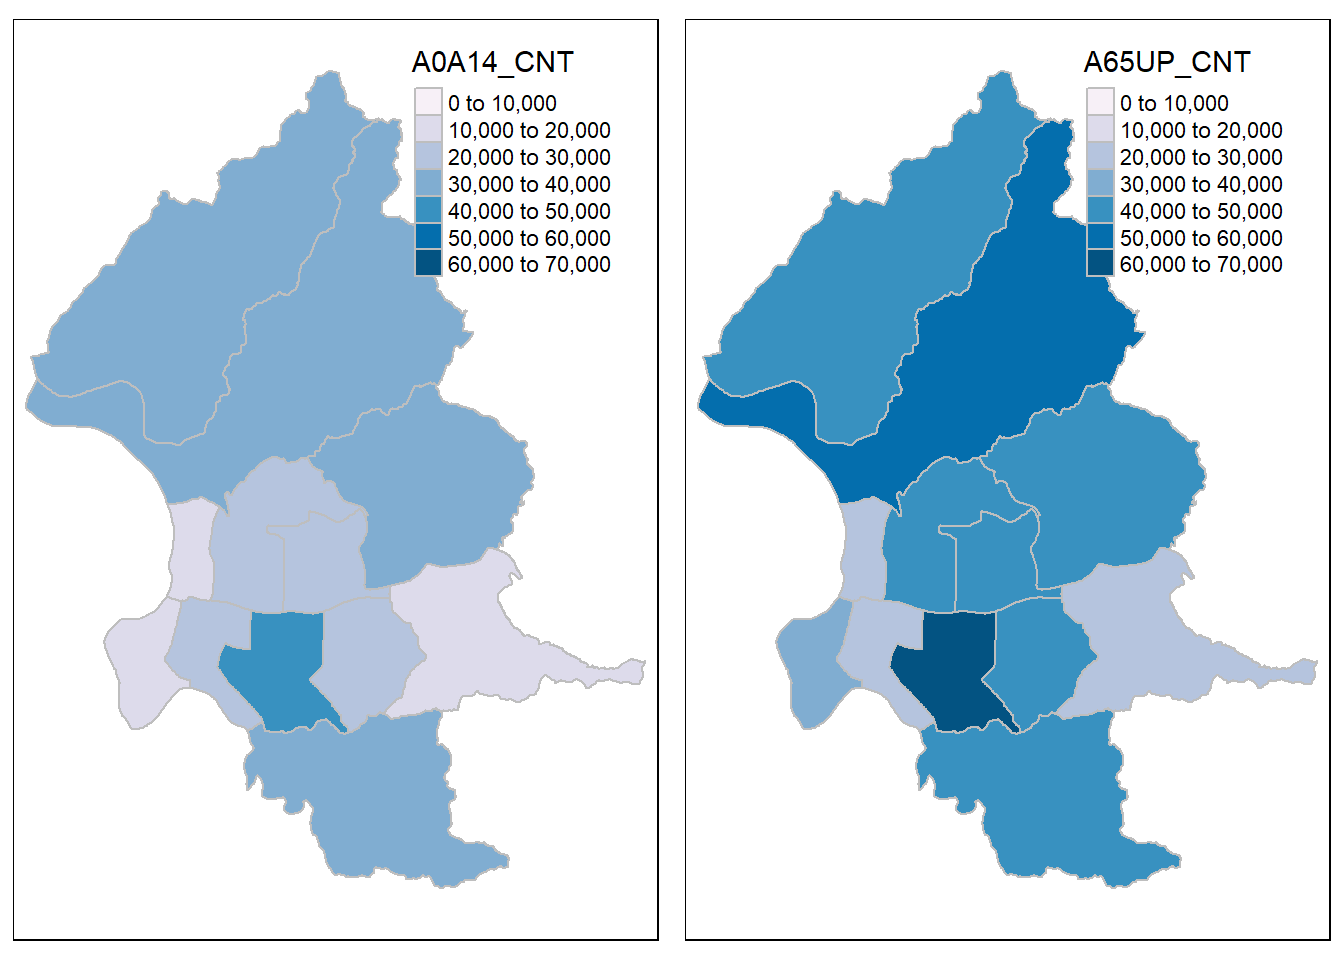
# 圖D <- tm_shape (town.taipei)+ tm_polygons (col= 'A0A14_CNT' ,palette= 'PuBu' ,border.col = 'gray' ,breaks= c (0 ,10000 ,20000 ,30000 ,40000 ,50000 ,60000 ,70000 ))# 圖E <- tm_shape (town.taipei)+ tm_polygons (col= 'A65UP_CNT' ,palette= 'PuBu' ,border.col = 'gray' ,breaks= c (0 ,10000 ,20000 ,30000 ,40000 ,50000 ,60000 ,70000 ))tmap_arrange (map.d,map.e)
如何將多張地圖自動並列顯示(facets)?
tmap也有跟ggplot2相似的可以自動產生分面圖的函數:tm_facets
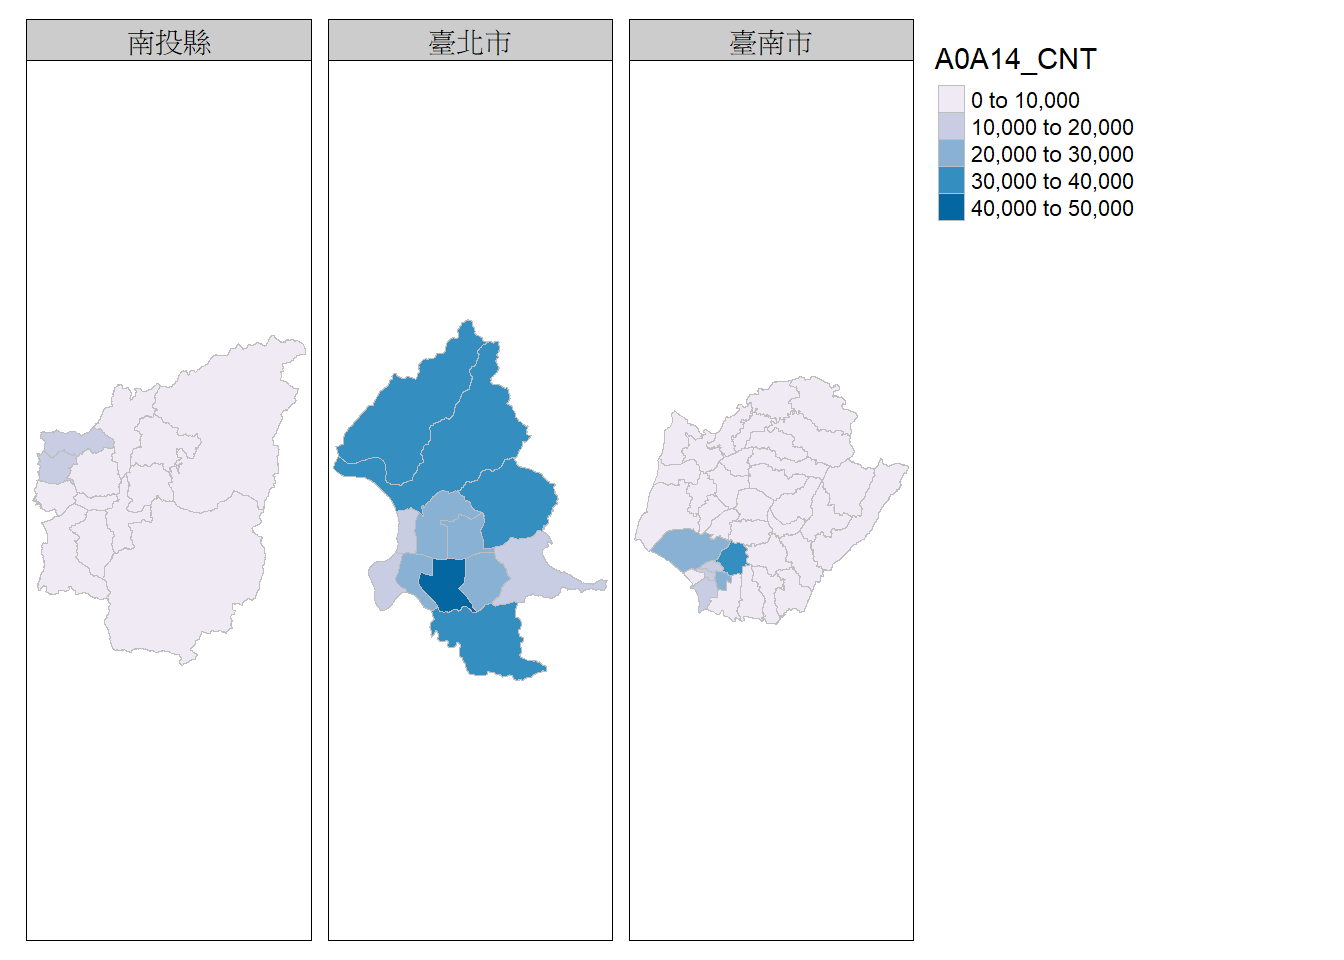
.1 <- filter (town,COUNTY%in% c ('臺北市' ,'南投縣' ,'臺南市' )) tm_shape (town.1 )+ tm_polygons (col= 'A0A14_CNT' ,palette= 'PuBu' ,border.col = 'gray' )+ tm_facets (by= 'COUNTY' )
如何將tmap的圖儲存成png、svg等格式?
<- tm_shape (town,xlim= c (119.1 ,122.2 ),ylim= c (21.8 ,25.4 ))+ tm_polygons (col= 'A0A14_CNT' ,palette= 'PuBu' ,border.col = 'gray' )+ tm_shape (county,xlim= c (119.1 ,122.2 ),ylim= c (21.8 ,25.4 ))+ tm_polygons (border.col = 'gold' ,alpha = 0.1 )tmap_save (map.a, filename= "map_a.png" , width= 1920 , height= 1080 , asp= 0 )
tmap_save常用選項
filename: 檔案名稱,附檔名可以為pdf, eps, svg, wmf (Windows only), png, jpg, bmp, tiff, html
width: 寬度
height:高度
units: 高度與寬度單位,可為"in", "cm", 或 "mm"
如何用tmap展示動態圖?
使用tmap_mode(“view”)可以繪製像是leaflet的可縮放的動態圖。使用完畢再使用tmap_mode(“plot”)回到繪製靜態圖的模式。
tmap mode set to interactive viewing
tm_shape (town.taipei)+ tm_polygons (col= 'A0A14_CNT' ,palette= 'PuBu' ,border.col = 'gray' )+ tm_text (text= 'TOWN' ,size = 0.5 )
tmap mode set to plotting
如何改變tmap的其他設置?
請見tmap_layout(),有許多選項可設定。